Autoscaler
Scaling overview
Section titled “Scaling overview”ICC implements a dual-algorithm framework for intelligent autoscaling:
- Reactive Scaling Algorithm - Responds in real-time to performance signals (ELU > 90%, Heap > 80%)
- Trends Learning Algorithm - Analyzes historical patterns to predict future scaling needs
Reactive Scaling Algorithm
Section titled “Reactive Scaling Algorithm”When @platfromatic/watt-extra notices that one of the applications is unhealthy, it sends a health alert to ICC. By default the reasons to send an alert are:
- high ELU (> 90%)
- high memory consumption (heap > 80%)
After receiving an alert ICC makes a decision to scale up or not based on alerts from other pods and historical data. When high load conditions end, the ICC will scale pods down automatically.
Trends Learning Algorithm
Section titled “Trends Learning Algorithm”The long-term scaling algorithm studies watt scaling patterns and scales watts up and down in advance to anticipate demand fluctuations and optimize resource allocation.
The Autoscaler Page
Section titled “The Autoscaler Page”On the Autoscaler page, you can see information about Kubernetes pod status and scaling events.
This image shows 2 pods in a healty state
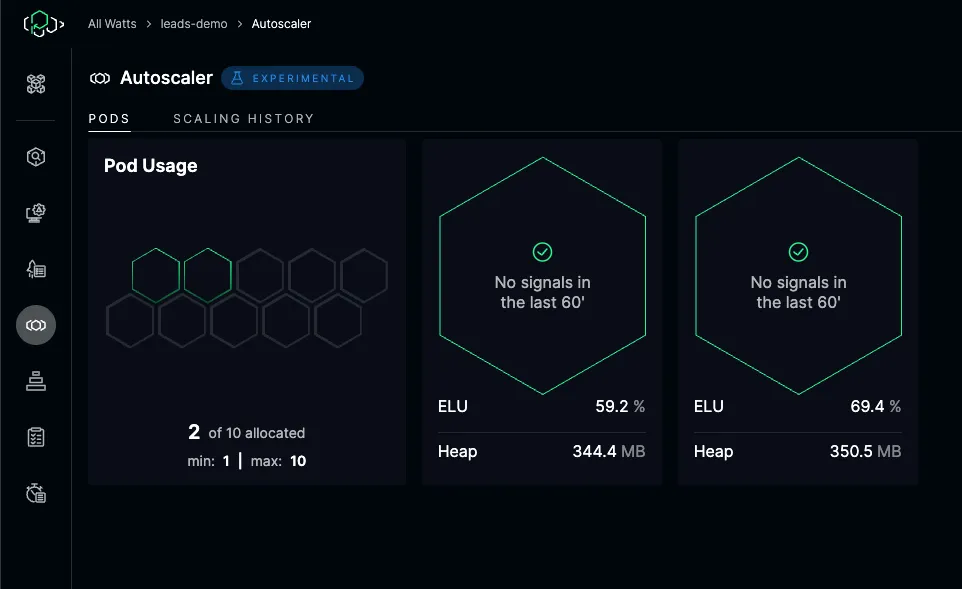
But pods can be in an un-healthy state which the algorithm will try to mitigate accordingly.
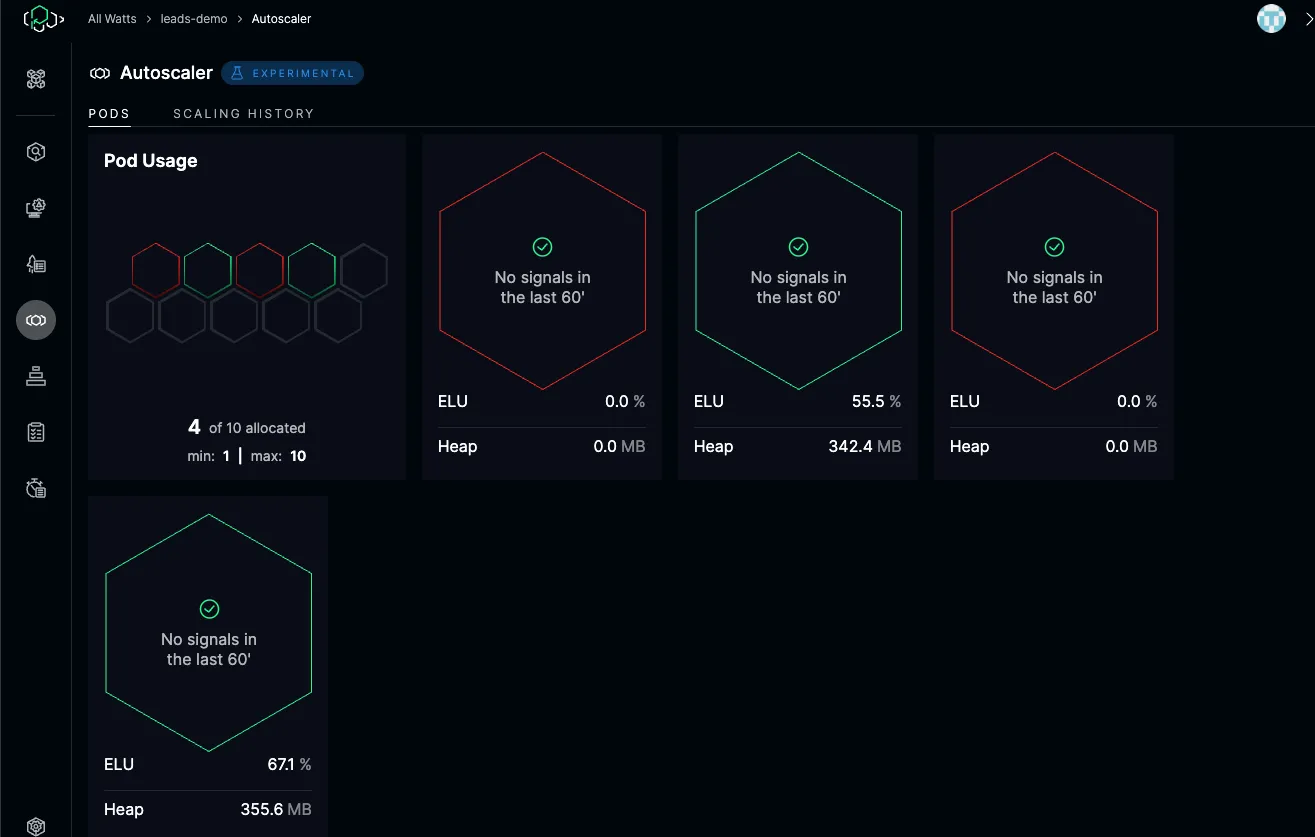
The first page is an overview of the running pods, with information about the latest signals received and HEAP/ELU metrics and a their state of health.
Clicking on one of the pods will send you to the Pod Detail section.
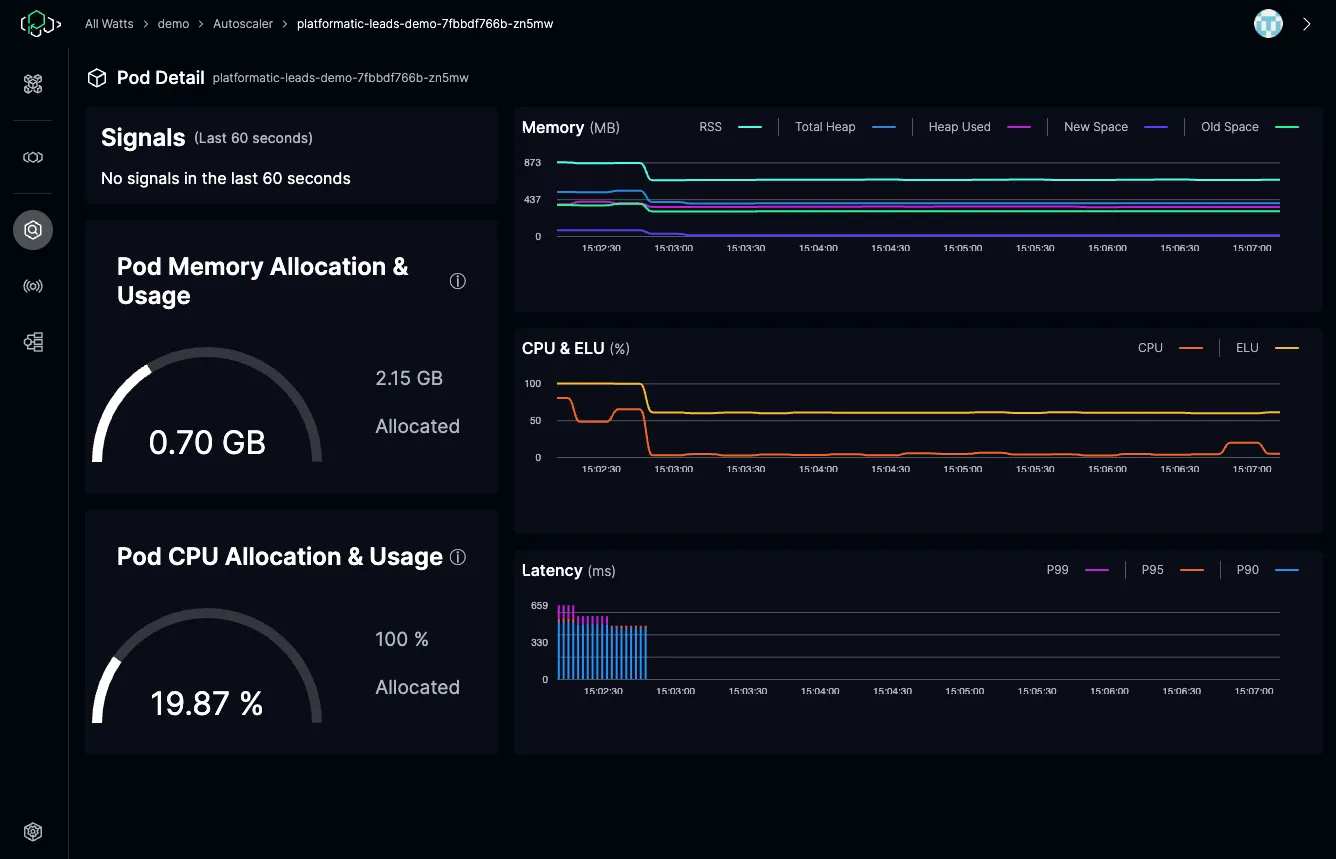
Pod Detail Section
Section titled “Pod Detail Section”The Pod Detail section has its own sidebar and has 3 sections. The first one is the Pod Detail page, where you can see
- The latest signals received
- Memory/CPU usage graphs
- Historic Trend of CPU, ELU, Memory and Latency
Then you have the Signals History page, with a list of the latest signals.
Clicking on one of the signals will open the details, explaining cause and effects of that signal. If the signal led to a Scaling Event, the button will send you to the Scaling History with the related scaling event highlighted.
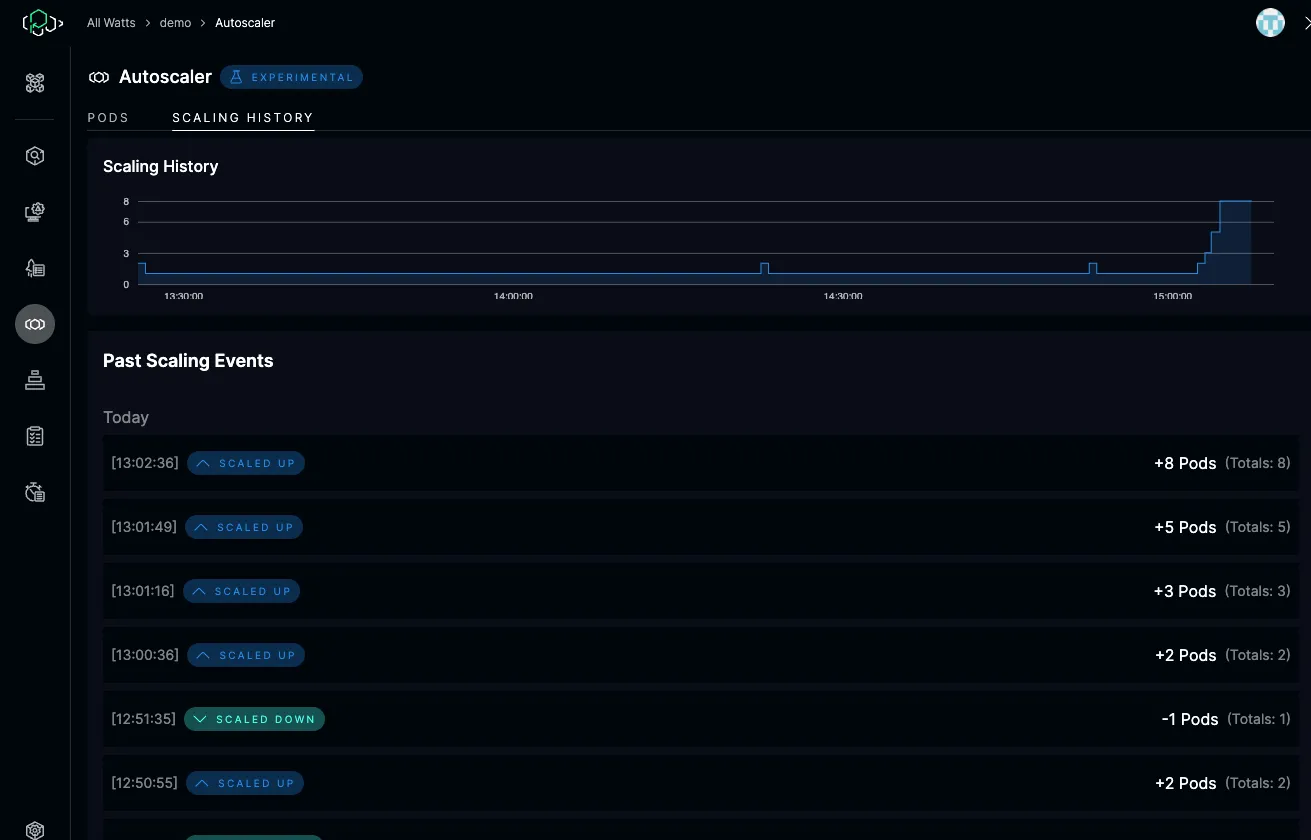
Scaling History Section
Section titled “Scaling History Section”Here you can find the list of all scaling events generated by the algorithm. Clicking on an event will show the reason why the event was generated and, if collected, CPU/ELU details for each application