Flamegraphs
Why are flamegraphs useful?
Section titled “Why are flamegraphs useful?”A flamegraph is a data visualization tool that helps the user understand in which functions the CPU has spent time on.
Watt sends profiling data to the Command Center flamegraphs when an alert is generated (i.e. Event Loop utilization or CPU usage over a threshold).
The Flamegraphs page
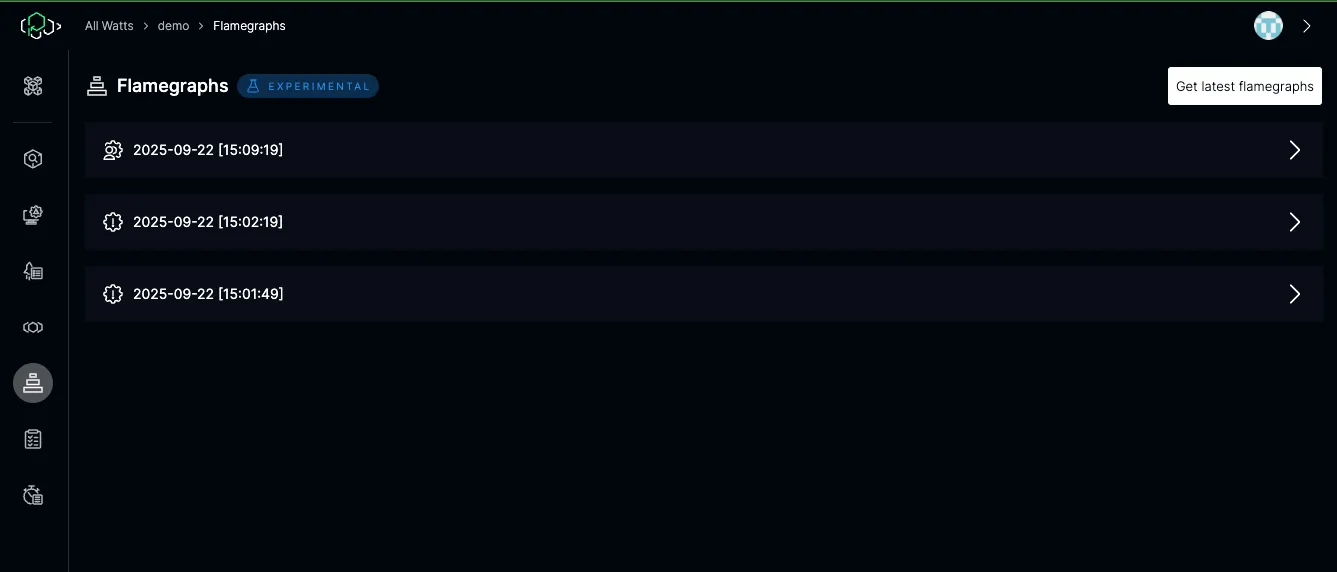
Section titled “The Flamegraphs page”The Flamegraphs page shows a list of all the flamegraphs collected, grouped by timestamp. There are 2 types of flamegraphs
- The ones generated by the algorithm
- The ones collected manually by the user
They have a custom icon to understand which type of flamegraphs are.
In this image there are 2 flamegraphs collected by the algorithm. Clicking on the top-right button…
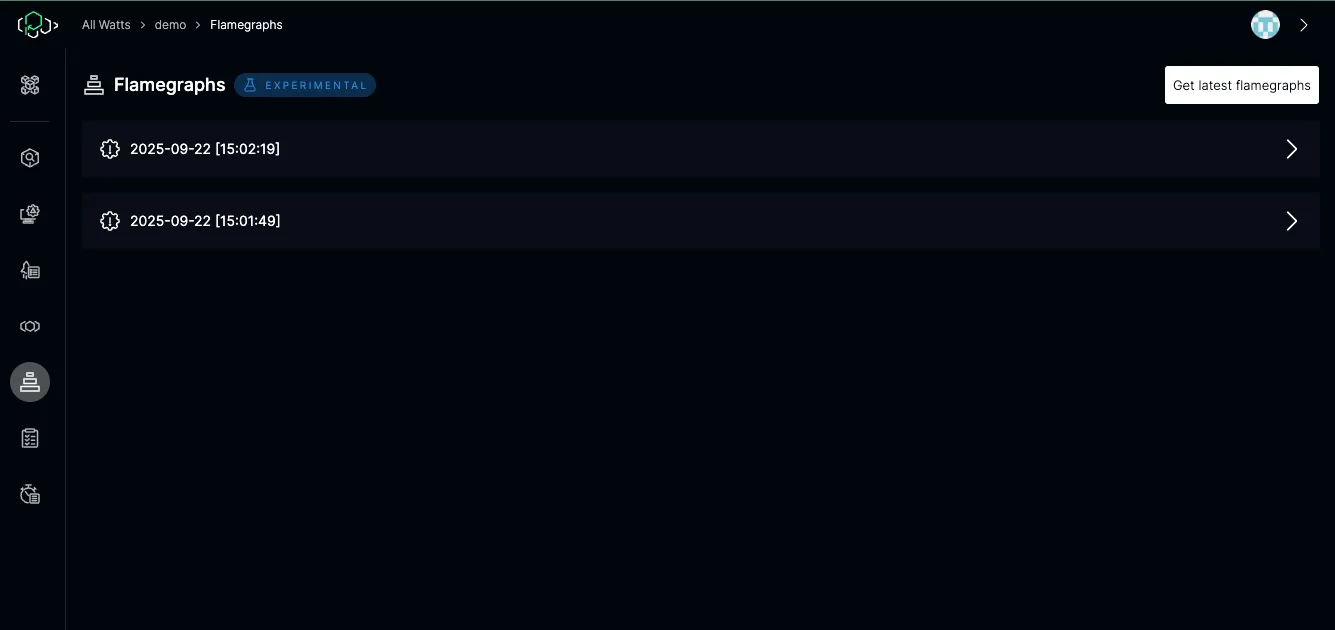
… will collect the flamegraphs for the current timestamp.
Clicking on one of the flamegraphs you can see for which internal service the flamegraphs was collected. For manually collected flamegraphs all services will send their data
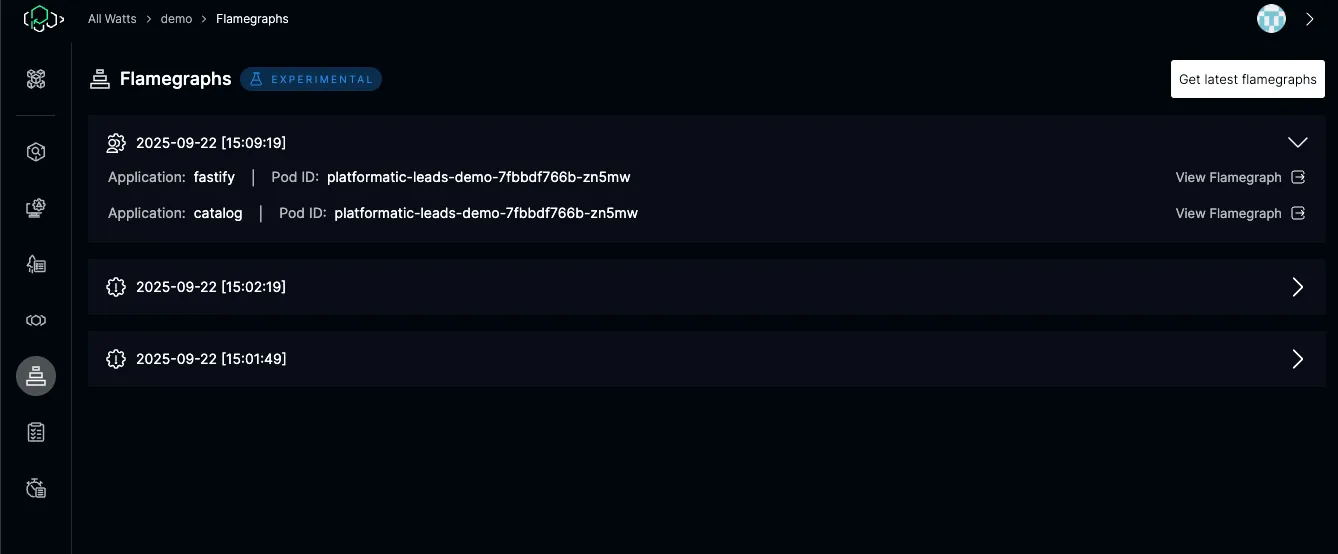
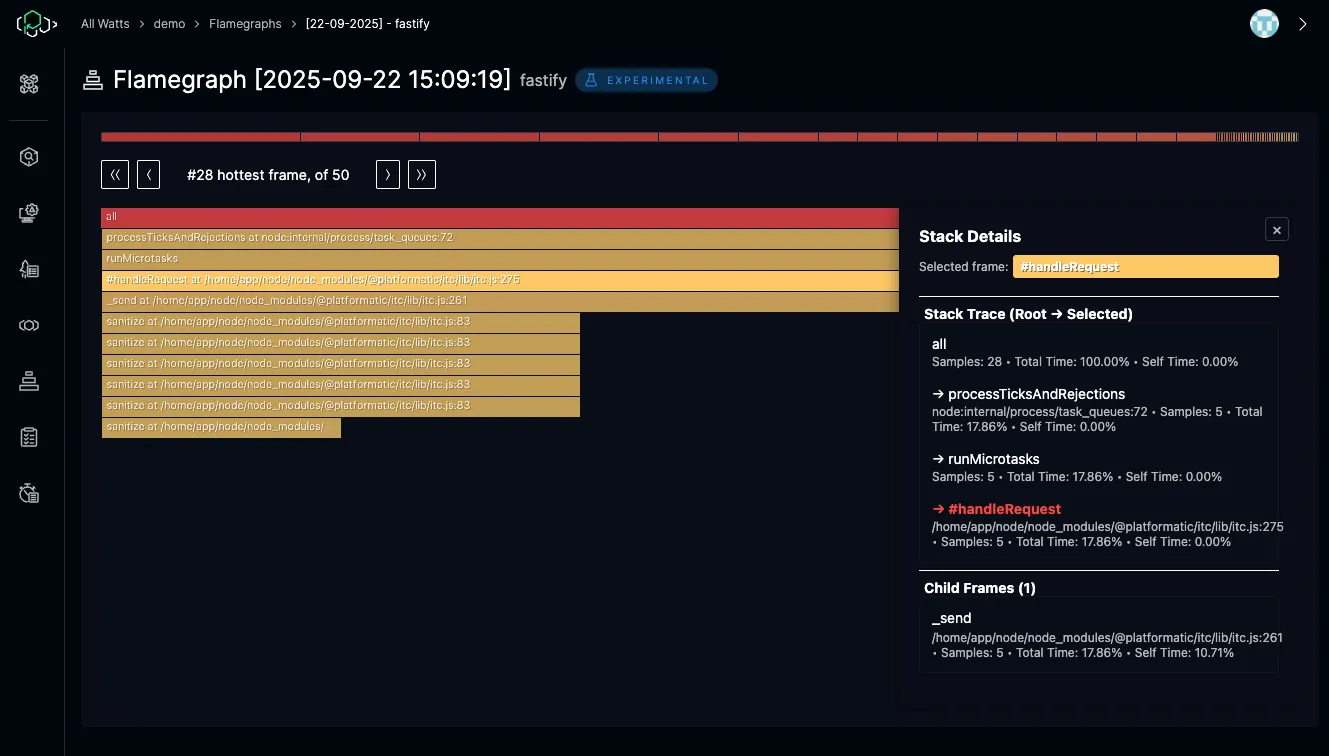
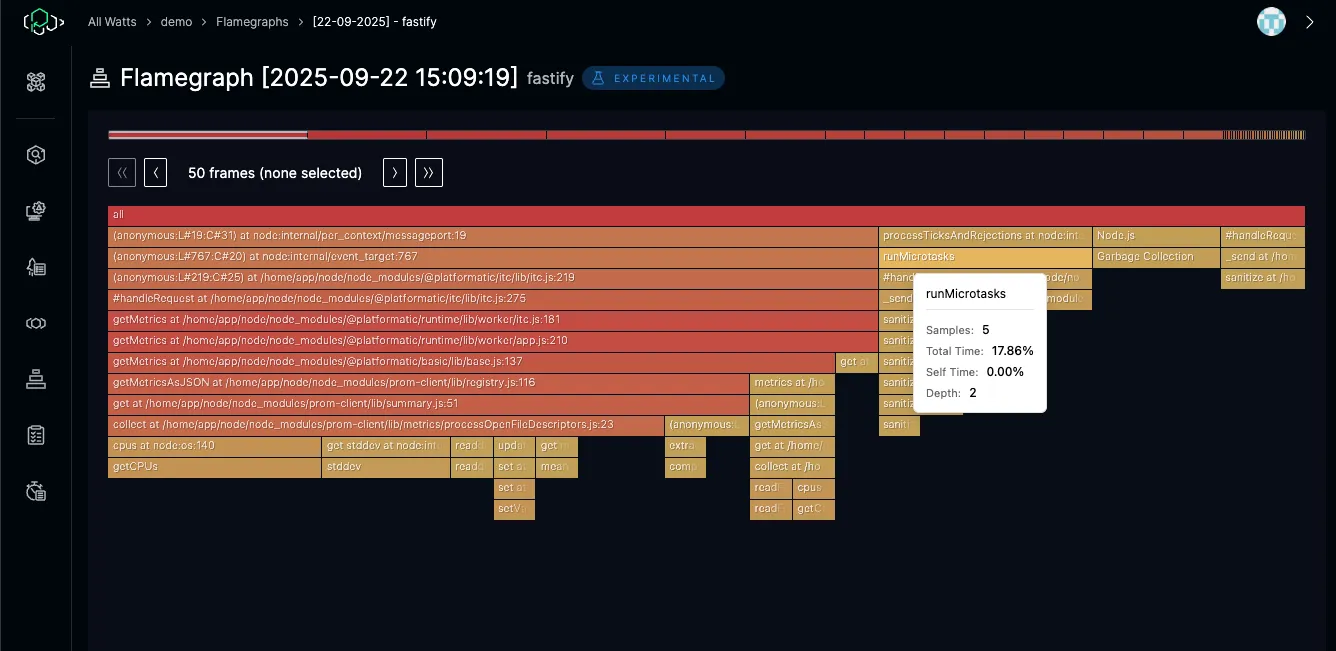
Clicking on “View Flamegraph” will send you to the Flamegraph detail page where you can see the flamegraph detail.
This page uses the @platformatic/react-pprof npm module.
Hovering your cursor over a section will show some data about the function.
Clicking on a section will open a stack trace of the selected function.