

Predictive Scaler (V2)
The Predictive scaler is the V2 ICC scaling algorithm. It forecasts where Node.js load will be when new application instances are ready, then adds capacity before the forecast crosses an application threshold.
Enable it with:
PLT_SCALER_ALGORITHM_VERSION=v2V2 replaces V1 when selected; the two algorithms do not run together.
| Reactive V1 | Predictive V2 | |
|---|---|---|
| Decision | Current metric exceeds its threshold | Forecast metric exceeds its threshold |
| Time horizon | Now | Expected instance readiness time |
| Input | Aggregated Prometheus metrics | Raw per-worker runtime samples |
| Memory | Recent evaluation window | Smoothed level, trend, and instance lifecycle |
| Scale-up redistribution | Observed after it happens | Stabilized in the prediction signal |
| Availability | Open source | Enterprise |
Why prediction matters for Node.js
Section titled “Why prediction matters for Node.js”A reactive scaler starts adding instances only after it observes overload. The infrastructure platform must still schedule new instances, initialize the application, complete readiness checks, and redistribute traffic. The existing instances carry the load throughout that interval.
For Node.js applications this delay is especially costly. Event Loop Utilization (ELU) measures the fraction of time the event loop is busy. As ELU approaches 1.0, the loop has almost no idle time, callbacks queue, and response latency rises non-linearly.
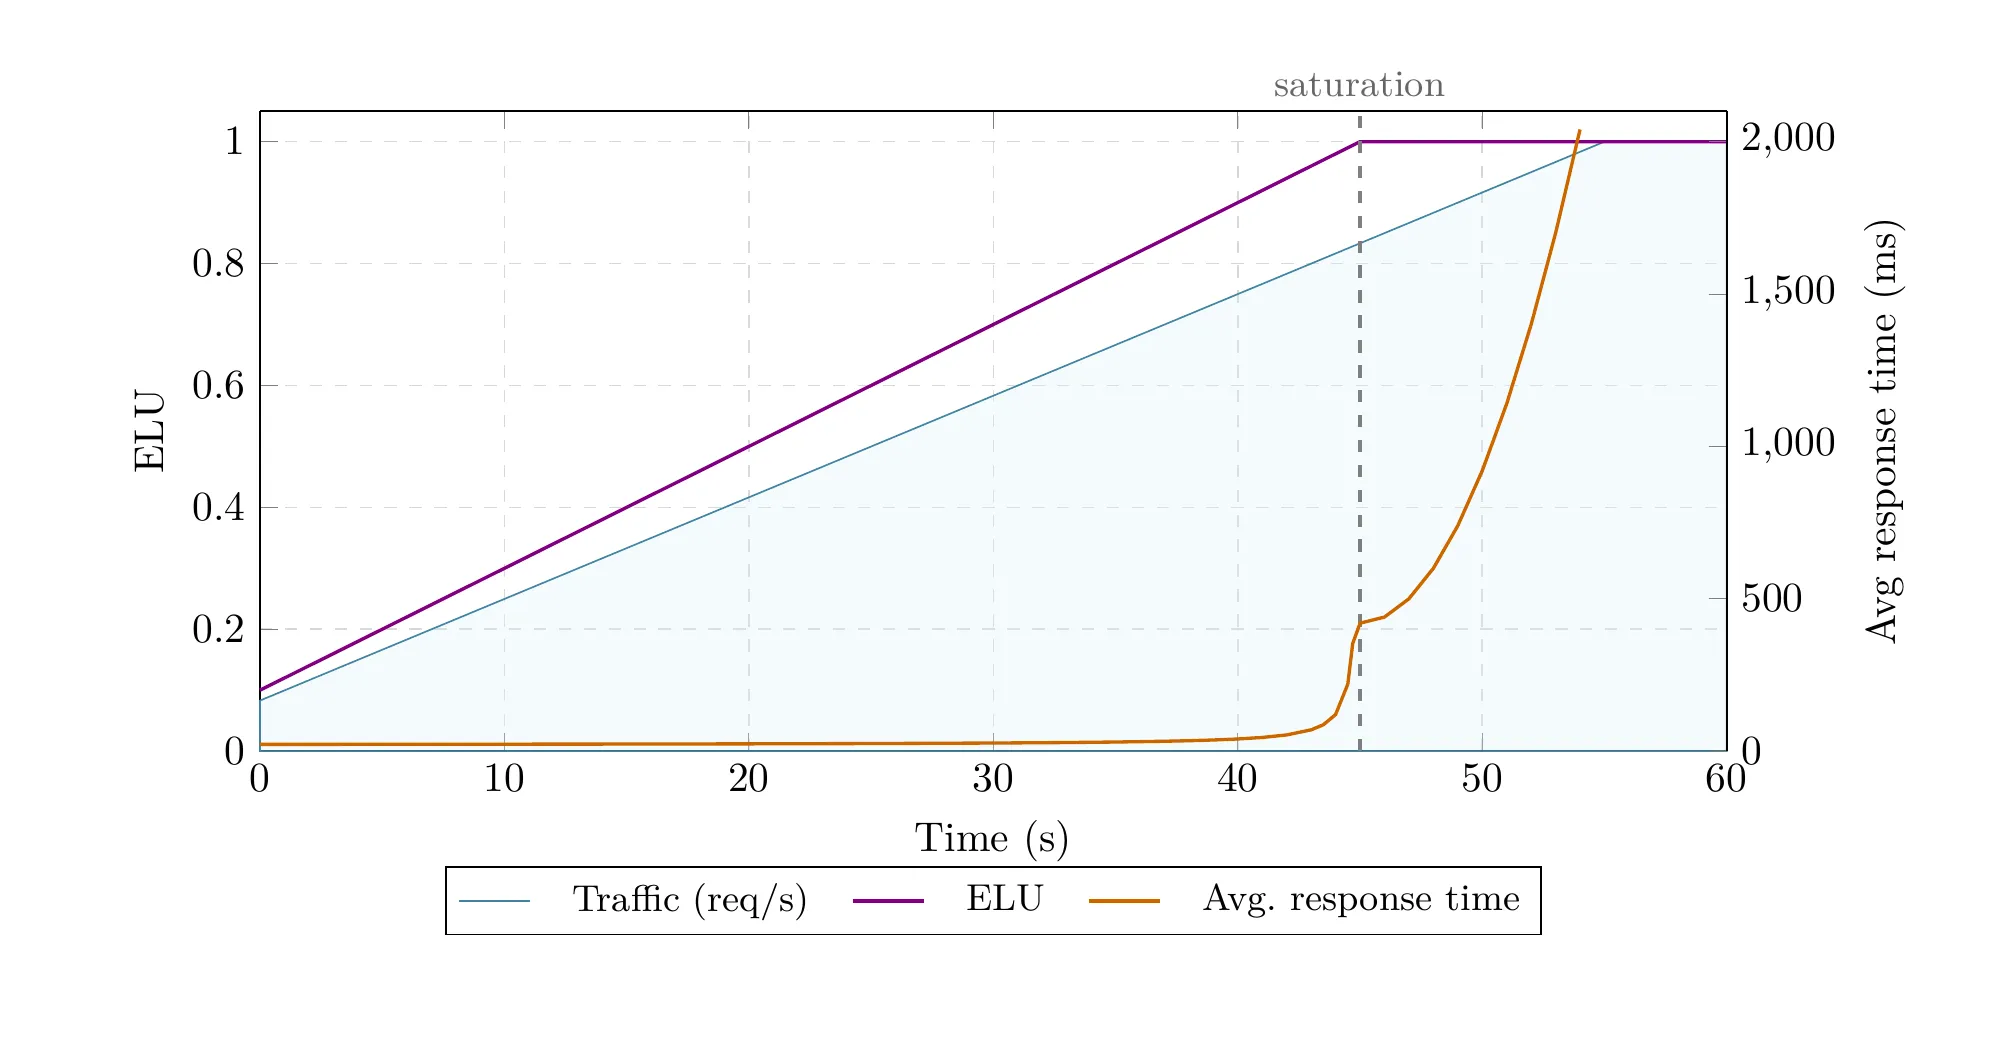
Lowering a reactive threshold creates more permanent headroom, but it does not remove the startup delay. V2 instead asks: will the application exceed its threshold by the time new capacity can serve traffic?
Runtime signals
Section titled “Runtime signals”V2 receives raw samples instead of a client-side average. This preserves short changes in the signal that would otherwise be hidden inside a polling window.
| Signal | What ICC receives | Why it is used |
|---|---|---|
| ELU | Samples for each service worker | Detects pressure on the Node.js event loop |
| Heap | Samples for each service worker | Detects memory pressure independently of ELU |
| Thresholds | ELU and heap limits supplied by the runtime | Defines safe per-worker operation for that application |
| Identity | Application, controller, deployment, instance, runtime, service, and worker | Keeps samples attached to the correct lifecycle and deployment |
| Lifecycle | Runtime connected, ready, and disconnected events | Tracks pending capacity, redeployments, and observed startup time |
ICC evaluates ELU and heap independently for every service. The service and metric requiring the most instances determine the application target.
From samples to a scaling decision
Section titled “From samples to a scaling decision”1. Align asynchronous samples
Section titled “1. Align asynchronous samples”Instances and workers send batches at different moments. ICC interpolates them onto a common time grid so values representing the same point in time can be compared.
If an instance has not yet reported a value for a time point, ICC temporarily reconstructs its contribution from the previous aggregate. A late real sample replaces the estimate when it arrives.
2. Stabilize traffic redistribution
Section titled “2. Stabilize traffic redistribution”Adding an instance changes per-instance metrics even when external demand is unchanged. A new instance gradually receives traffic while existing instances drain queued and in-flight work. Treating this as an immediate drop in demand could cause the scaler to stop too early or reverse its decision.
ICC therefore builds a cluster-wide signal and gradually incorporates a new instance during the redistribution interval. This separates a change in total demand from the temporary effect of changing the instance count.
3. Estimate level and trend
Section titled “3. Estimate level and trend”ICC applies Holt double-exponential smoothing to the cleaned aggregate. The model maintains:
- level: the smoothed current load;
- trend: the direction and rate of change.
Upward and downward changes use different smoothing parameters. Sustained increases are followed quickly, while short downward movements are treated more conservatively to reduce premature scale-down.
4. Forecast to instance readiness
Section titled “4. Forecast to instance readiness”The prediction horizon is based on observed time from a scale-up decision until a new runtime connects and becomes ready. ICC applies a safety multiplier and configured minimum and maximum bounds; the defaults constrain the horizon to 25–40 seconds.
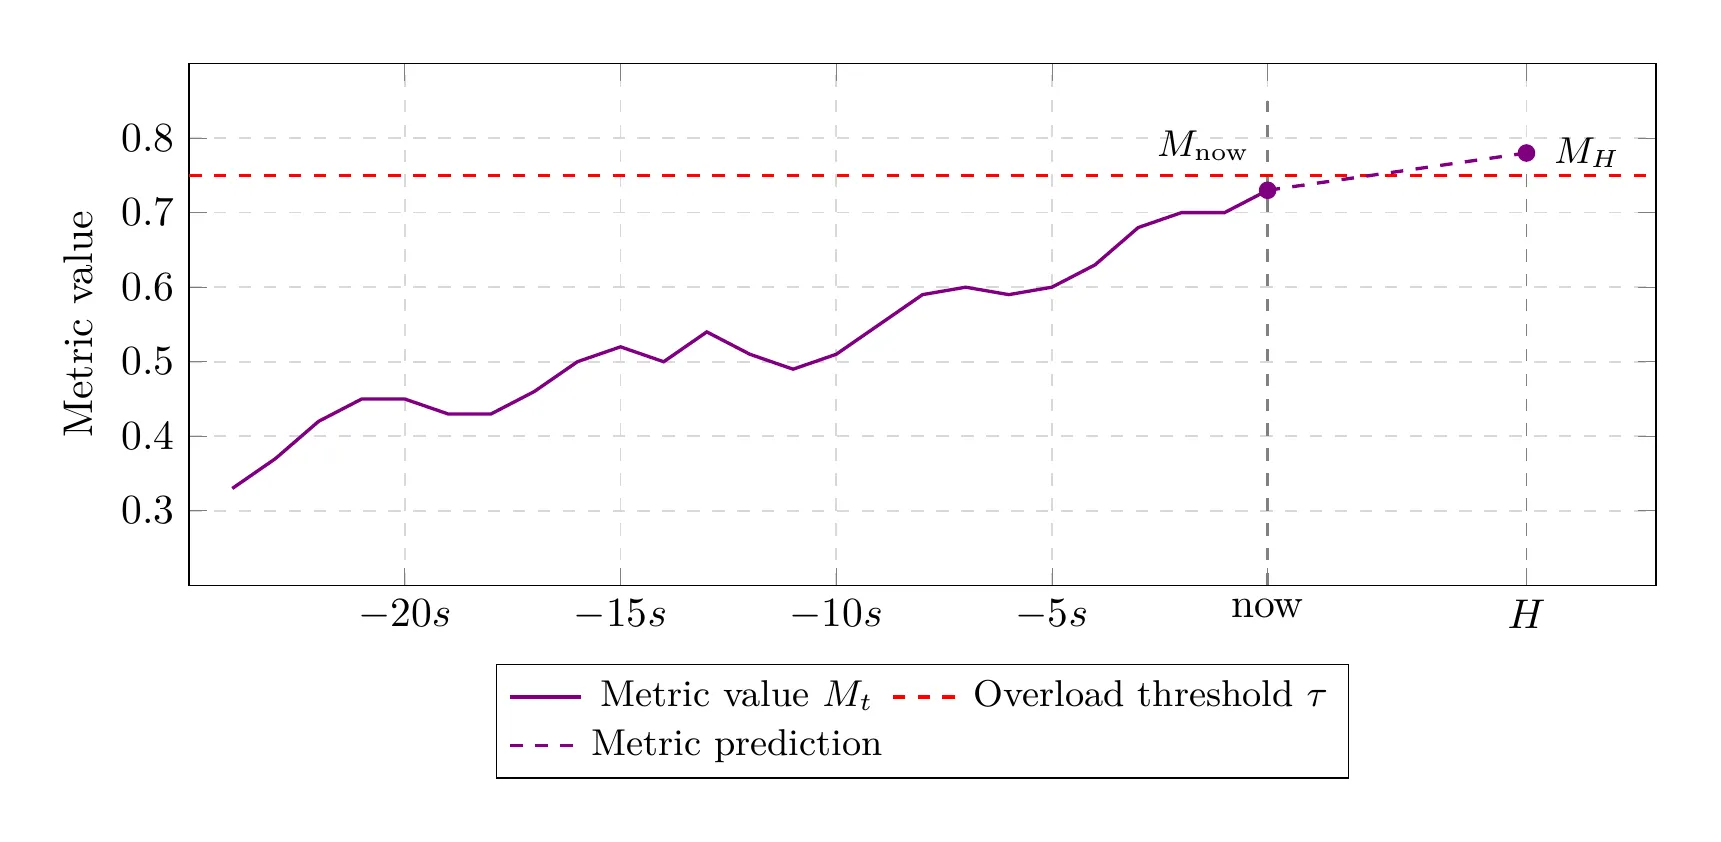
In the diagram, the current value remains below the overload threshold, but its projection at horizon H is above it. V2 scales now rather than waiting for the current value to cross the threshold.
5. Calculate the instance target
Section titled “5. Calculate the instance target”Conceptually, ICC asks how many instances are required to keep the forecast aggregate below the per-instance threshold. It then:
- chooses the largest requirement produced by any service and metric;
- accounts for instances that are already starting;
- limits how many instances one decision can add;
- applies scale-up or scale-down cooldowns;
- clamps the result to the application’s hard scaling limits.
The decision history records the triggering service and metric, current and forecast values, threshold, and instance-count snapshots.
Special cases
Section titled “Special cases”Metric saturation
Section titled “Metric saturation”ELU is capped at 1.0. A flat saturated signal does not mean demand stopped increasing. V2 preserves the established upward trend while the metric is clipped, so ICC can continue adding capacity instead of becoming stuck at the ceiling.
Deployments and restarts
Section titled “Deployments and restarts”V2 tracks deployment and runtime identities. Prediction is paused during a redeployment so replacement instances are not interpreted as demand-driven scaling. Startup observations from later scale-up events refine the readiness horizon.
Scale-down
Section titled “Scale-down”When load is not rising and current values remain safely below their thresholds, V2 calculates a smaller target with a safety margin. Scale-down uses longer cooldowns after scale-up and cannot go below either the hard minimum or an active Planner floor.
What the benchmark demonstrates
Section titled “What the benchmark demonstrates”The following results come from the linked ICC predictive-scaling benchmark, not from a production service-level guarantee. The same Next.js 16 application, cluster, and traffic profiles were used for ICC, KEDA, and HPA. Each pod had one worker, 1 CPU, and 2 GB of memory; an Envoy slow start gradually introduced traffic to cold pods.
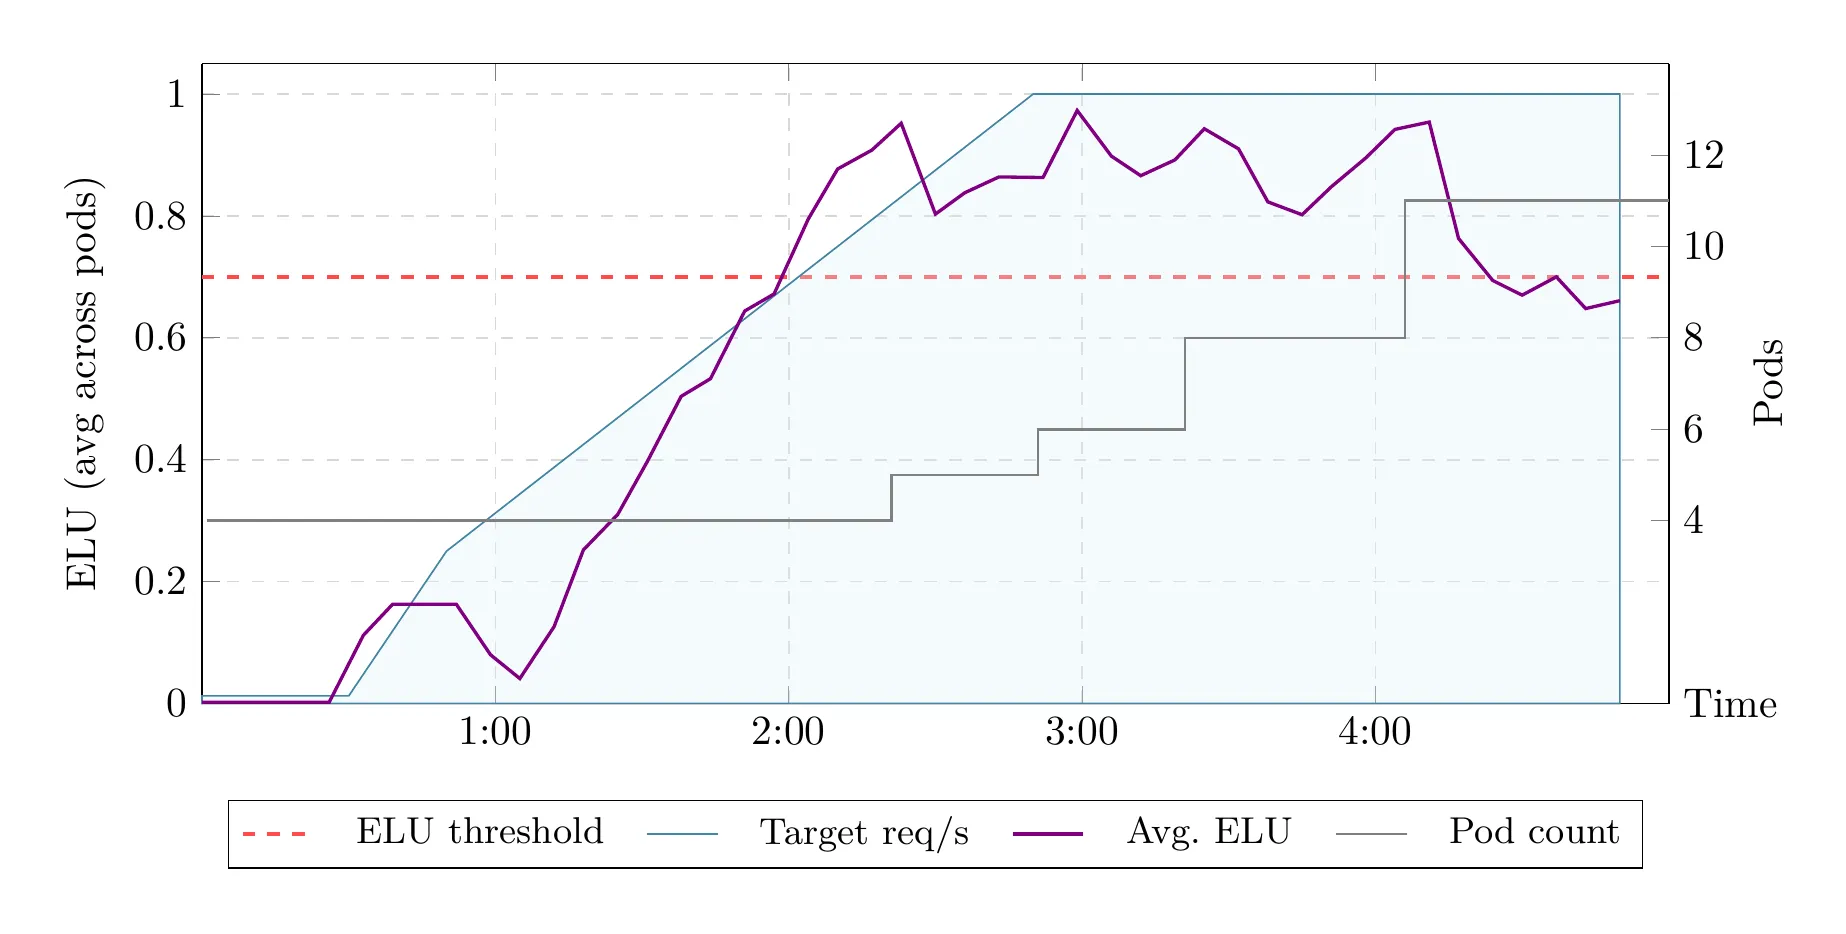
Steady traffic ramp
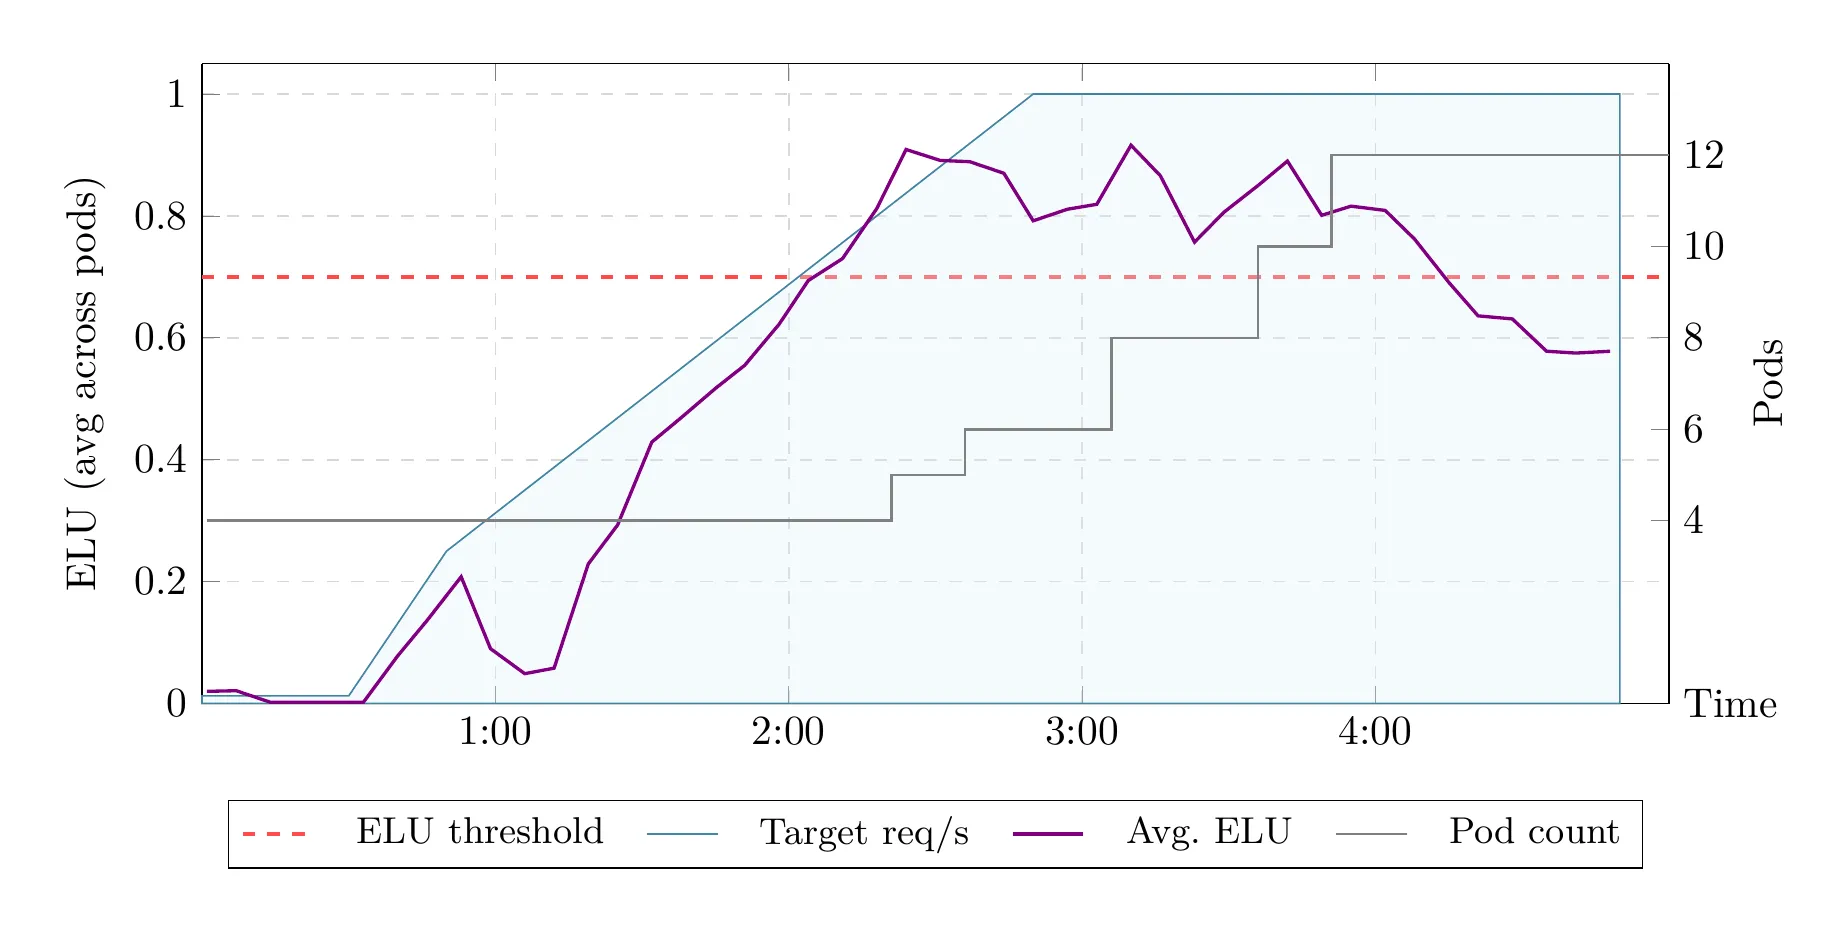
Section titled “Steady traffic ramp”Traffic increased from 10 to 800 requests per second over approximately 2.5 minutes, then remained at 800 requests per second for 90 seconds. This profile gives V2 enough history to observe the trend and provision ahead of it.
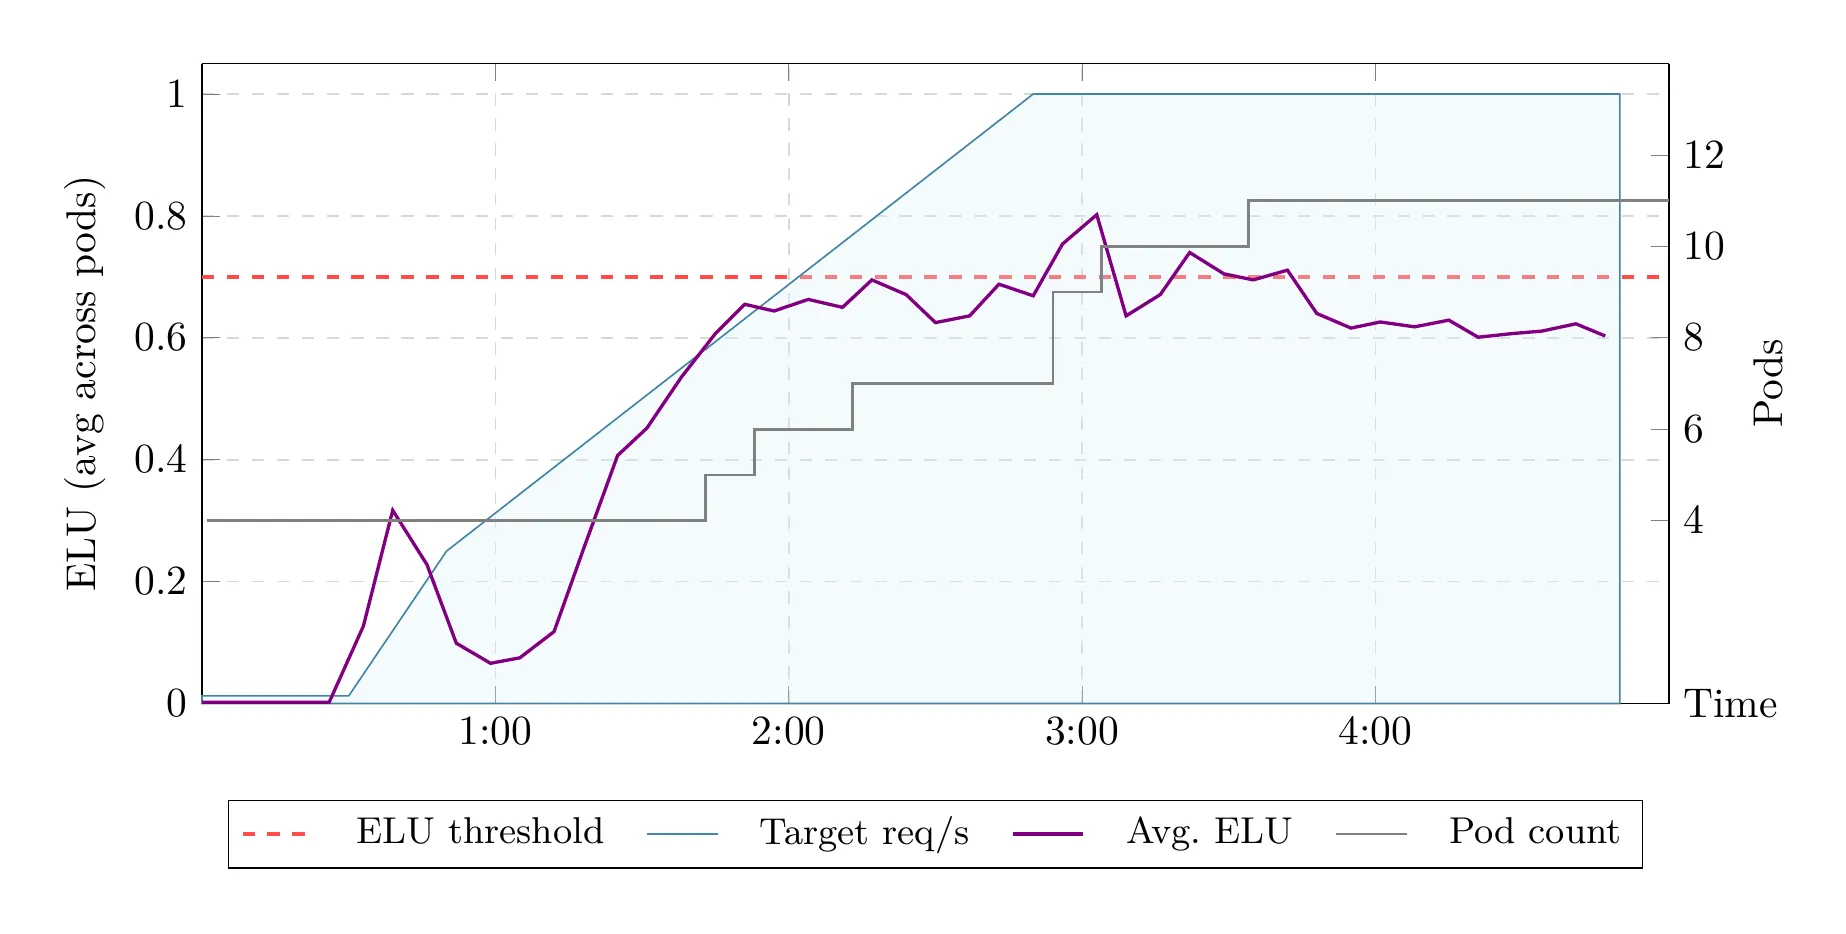
| Result | ICC | KEDA | HPA |
|---|---|---|---|
| Success rate | 99.47% | 95.11% | 90.97% |
| Average latency | 167 ms | 1,174 ms | 1,499 ms |
| Median latency | 26 ms | 154 ms | 522 ms |
| p90 latency | 317 ms | 3,530 ms | 4,168 ms |
| p99 latency | 1,970 ms | 10,001 ms | 10,001 ms |
| Errors | 718 | 6,591 | 12,039 |
Compare all steady-ramp charts
Sudden traffic spike
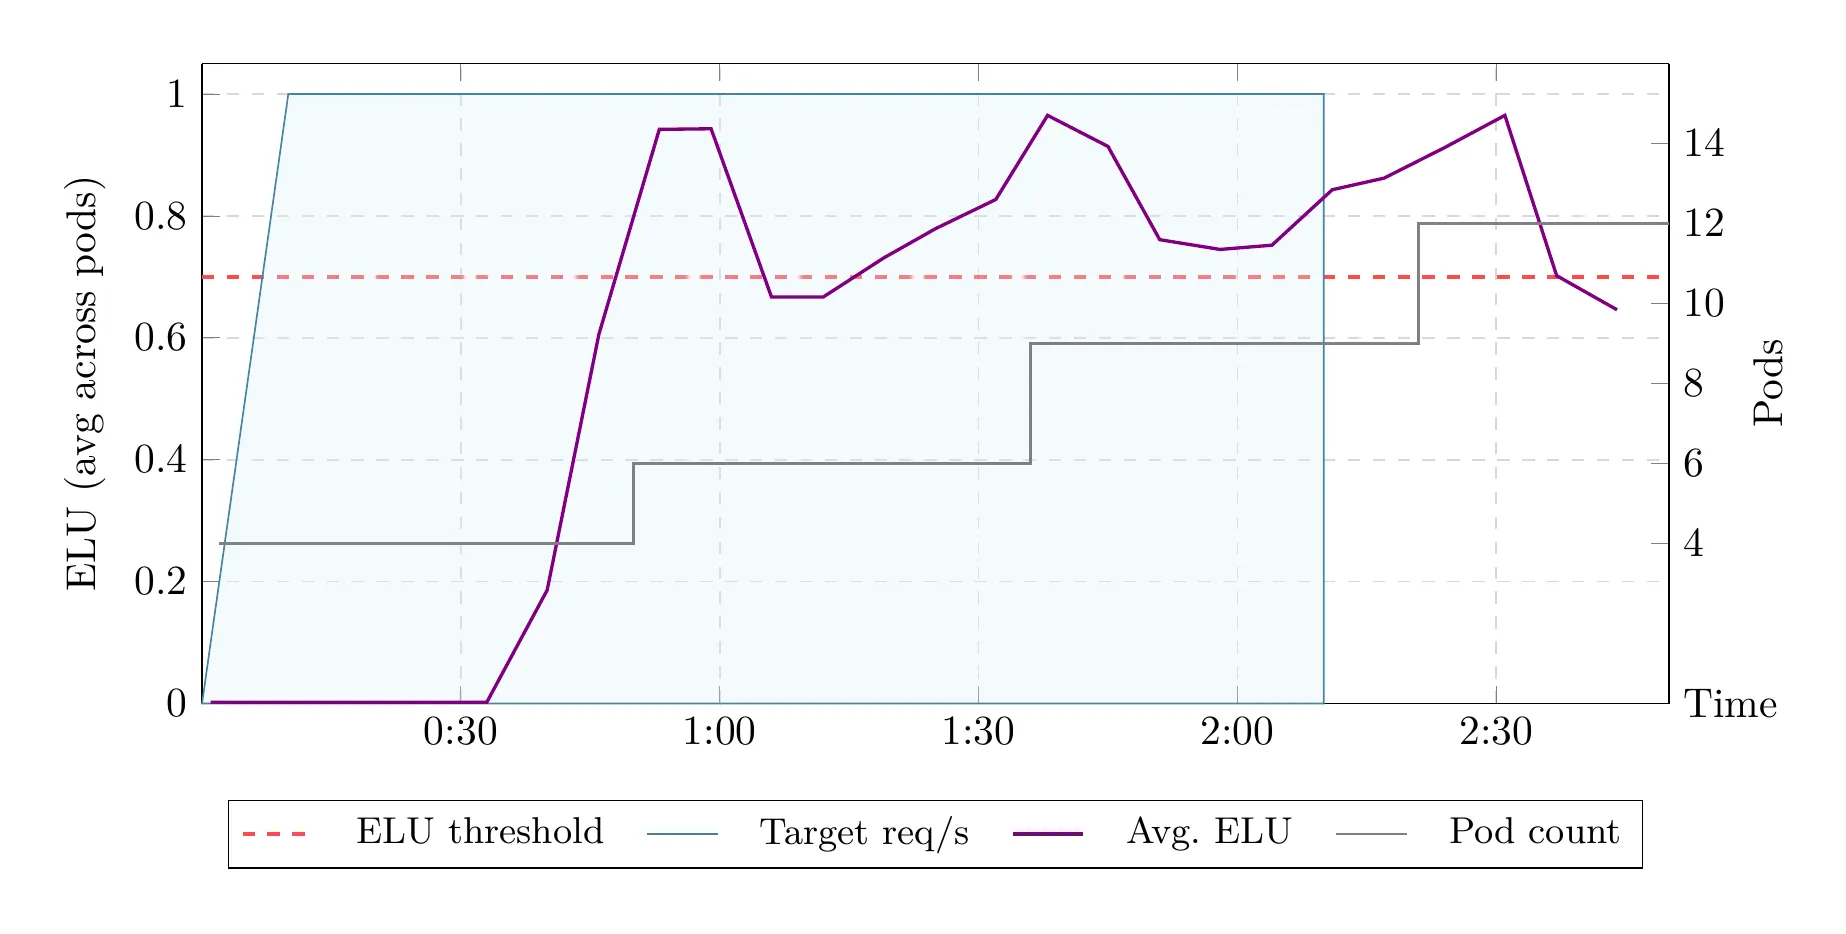
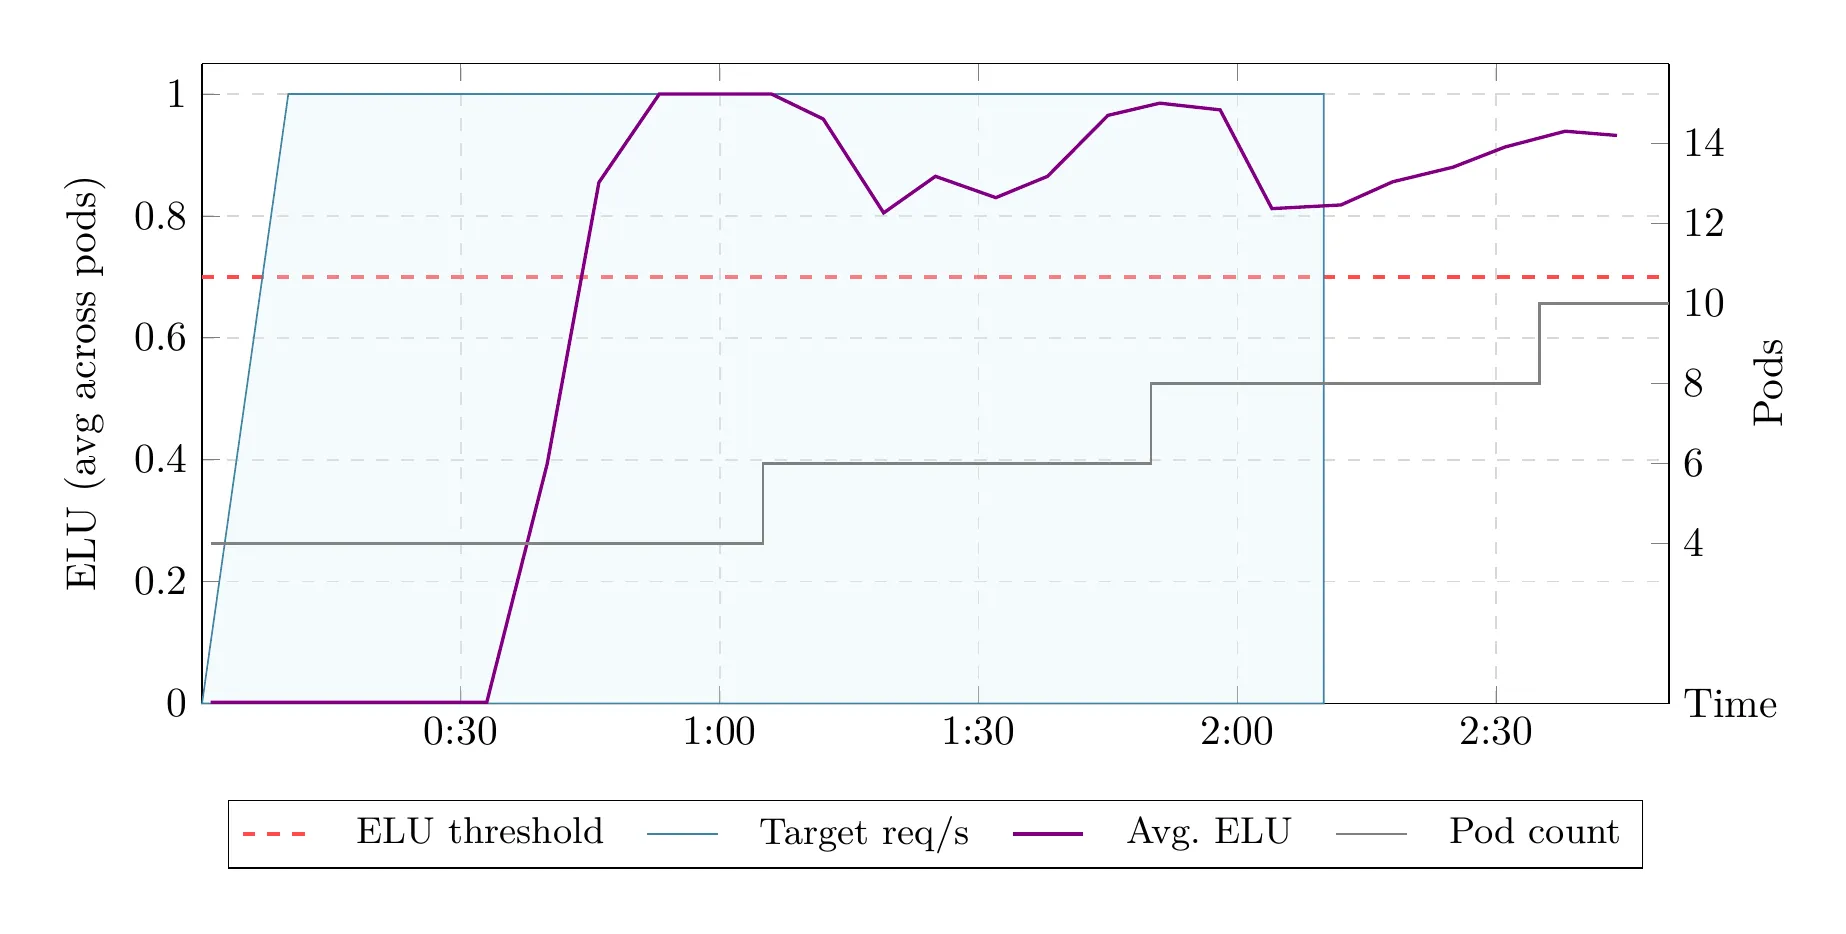
Section titled “Sudden traffic spike”Traffic increased from 0 to 800 requests per second in 10 seconds, then remained there for 120 seconds. No scaler can provision before a completely unexpected jump. The comparison measures how quickly each one recovers after the first samples arrive.
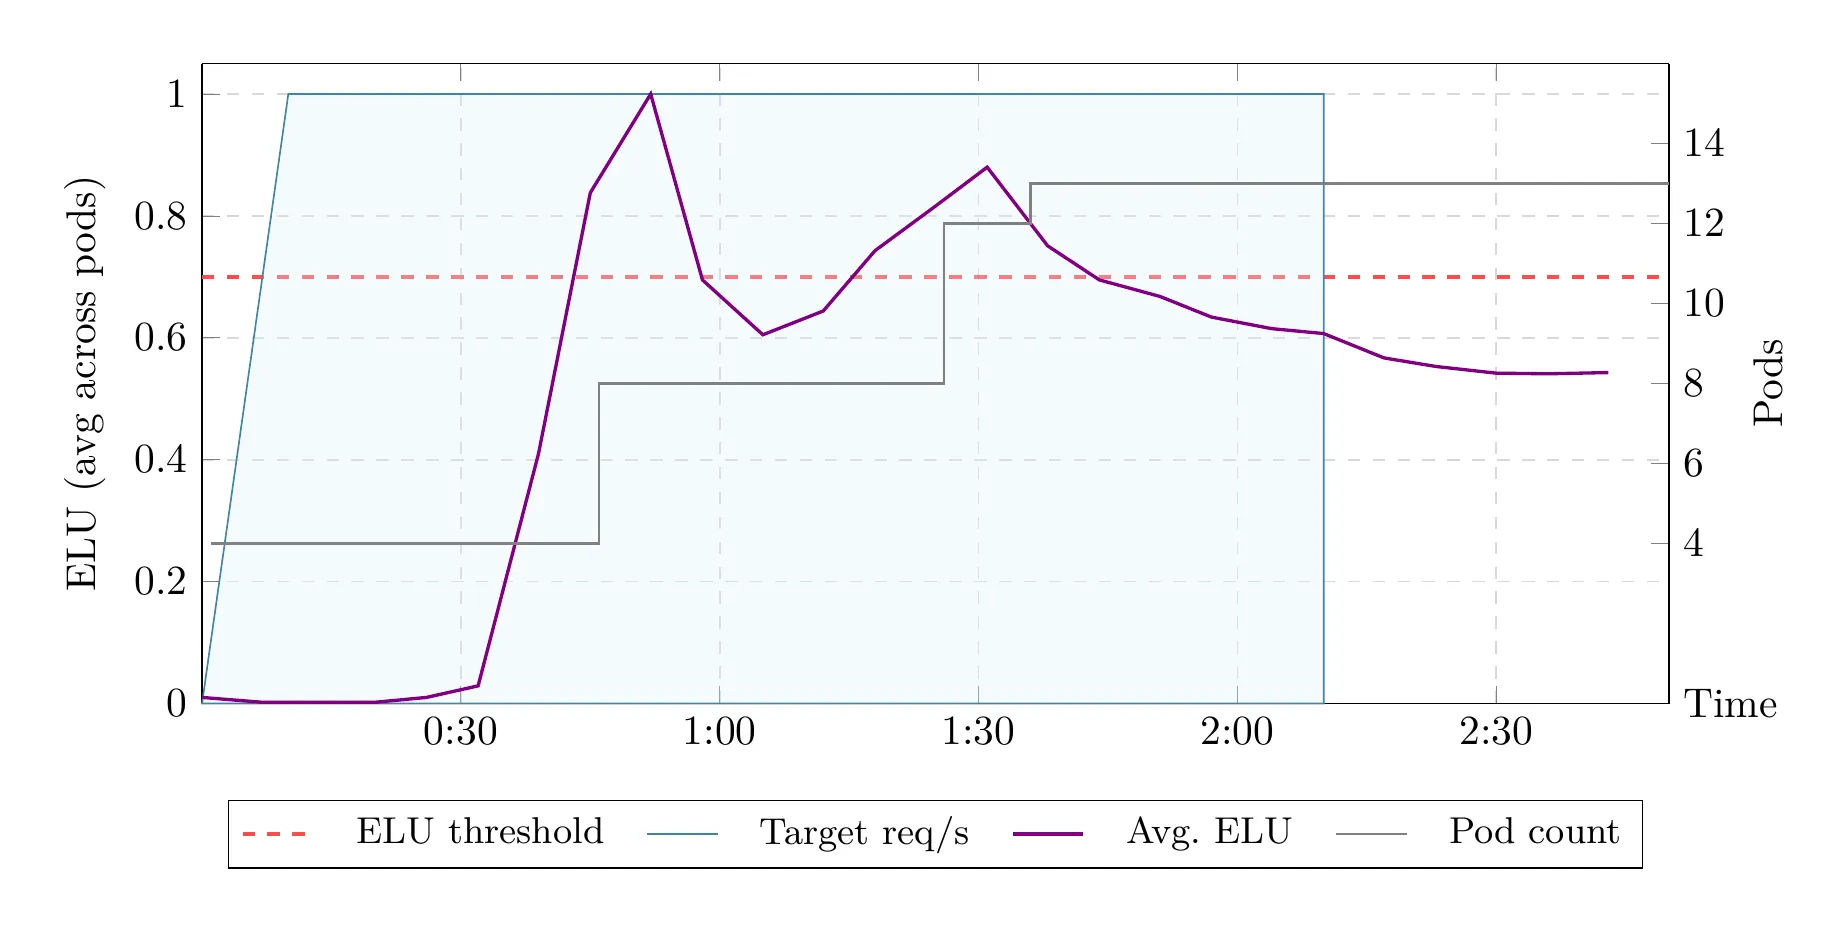
| Result | ICC | KEDA | HPA |
|---|---|---|---|
| Success rate | 91.51% | 87.47% | 77.31% |
| Average latency | 1,126 ms | 1,989 ms | 2,205 ms |
| Median latency | 55 ms | 855 ms | 1,102 ms |
| p90 latency | 3,385 ms | 6,108 ms | 7,338 ms |
| p99 latency | 10,001 ms | 10,001 ms | 10,001 ms |
| Errors | 8,028 | 11,212 | 21,067 |
Compare all sudden-spike charts
Operate V2
Section titled “Operate V2”Before enabling V2, verify that:
- applications use
@platformatic/watt-extra1.14.0 or newer and@platformatic/runtime3.25.0 or newer; - ELU and heap thresholds are appropriate for the workload;
- hard minimum and maximum instance counts are configured;
- the deployment environment has enough compute capacity for the requested instances, or can provision it through infrastructure autoscaling;
- startup and readiness behavior in the target environment is representative.
The Autoscaler view exposes current and predicted instance counts, ELU and heap values by service, thresholds, trend direction, pending scale-ups, runtime lifecycle, and effective limits. Set PLT_SCALER_DASHBOARD_API_ENABLED=true only when the additional debug fields in prediction history are needed.
See Scaling Configuration for tuning. The defaults are designed to work together; change them only after observing a representative workload.
For the full rationale and reproducible comparison, see Ahead of Time Scaling: How Platformatic ICC Predicts and Provisions, the algorithm paper, and the benchmark repository.